用WangEditor富文本编辑,上传图片的时候,本文主要记录一下Tomcat映射虚拟路径到指定磁盘,保存到指定路径中,且能实现页面预览。
在实现之前wangeditor的简单实用请参照博主小道仙的后宫,写的很详细:http://www.xdx97.com/#/single?bid=cf8563cb-5dc0-d48e-fdda-1c7e152f0a48
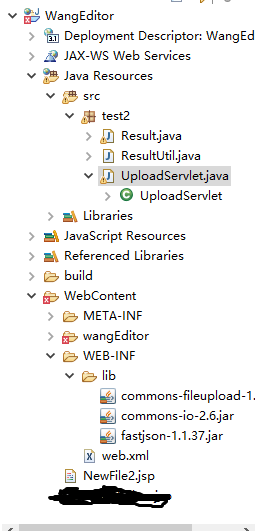
我的项目demo如下:
在服务器上添加对应的影射路径

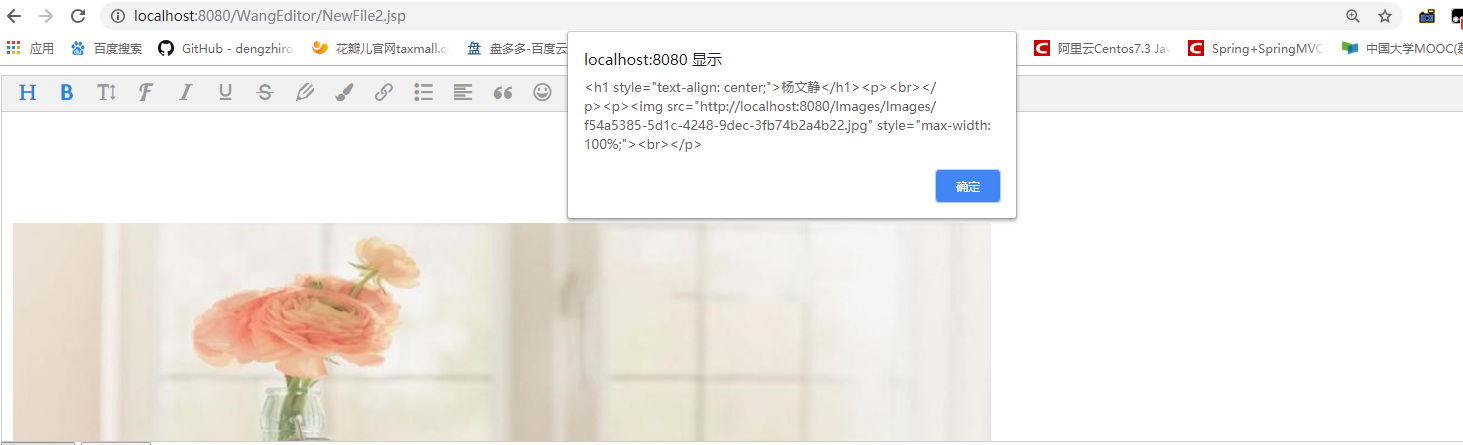
映射路径配置好后,运行Tomcat可直接访问映射路径下的图片:
访问格式为:http://localhost:8080/ + 上面配置的映射路径/Images("/Images"代替了映射路径的“D:\File”)+ 实际路径中的/images/1.jpg
拼接后就是:http://localhost:8080/Images/Images/1.jpg

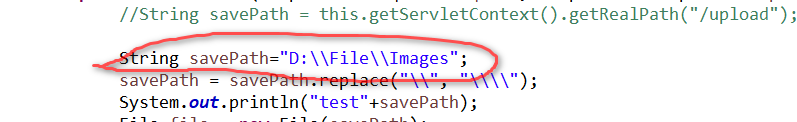
想要图片在文本框中回显,需要修改下代码,savePath路径换成自己保存的路径;
拼接路径:此处的IPPort为:http://localhost:8080
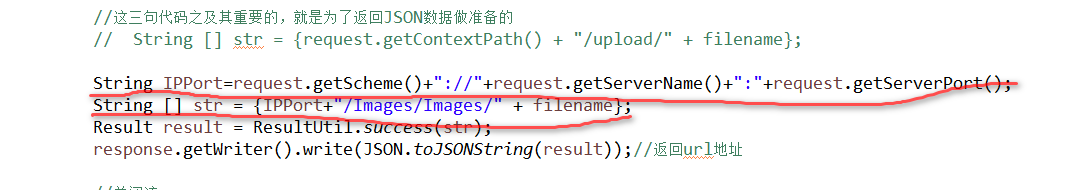
项目运行成功的代码如下: